Highlights:
- The average FICO score in the US rose 5 points from 2020 to 2021.
- Roughly 20% of adults in the US (52.8 million) have either no credit history or no recent credit activity.
- The majority of Americans have a “good” credit score, both in the FICO (67%) and VantageScore (62.5%) scoring models.
- 6% of Americans have a perfect credit score (850).
- Average interest rates on car loans are over three times higher for people with credit scores of 300–660 than those with scores of 661–850.
Table of Contents
General credit score statistics and trends
Here are the most recent statistics on credit score trends among Americans in the past few years. Take a look at the score distribution in the US and how credit scores are associated with different demographic factors.
1. Average credit scores are on the rise
The chart below shows that credit scores have been on the rise in the US for several years, with FICO scores consistently tending to be higher than VantageScore credit scores.

It’s worth noting that the average credit score also varies according to certain factors, such as geographical location, age group, and race/ethnicity. You can also check out our statistics on the:
2. Credit scores are higher among higher-income adults
Although your income doesn’t directly affect your credit score, statistics show that people who earn more tend to have higher credit scores. This isn’t surprising—income can have indirect effects on your credit, e.g., by influencing your ability to pay your bills.
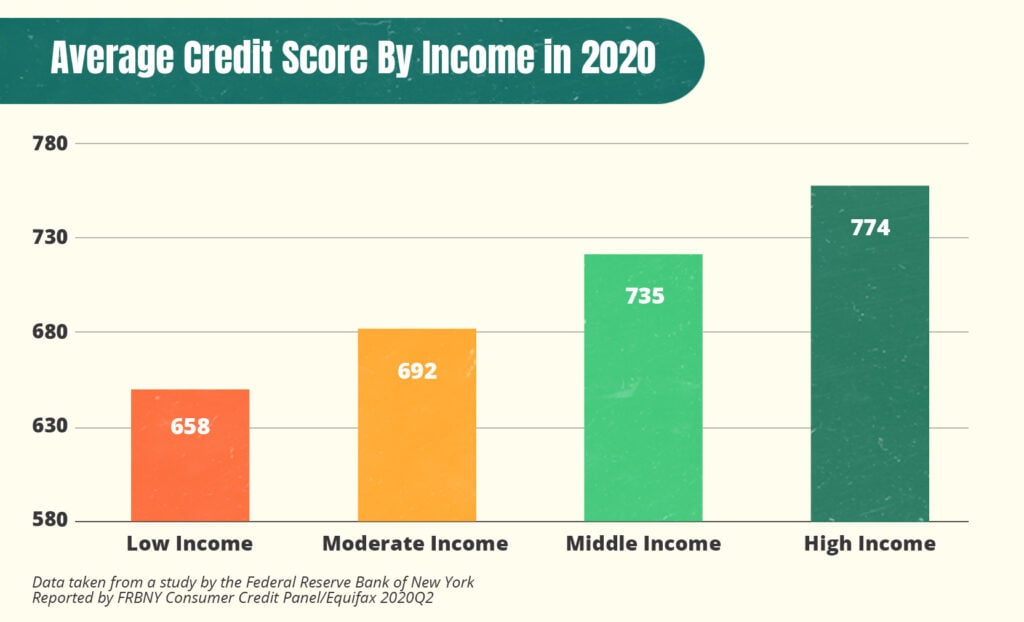
Numbers reflect median Equifax Risk Scores (a type of FICO credit score).1
3. 11% of Americans have no credit history
The Consumer Financial Protection Bureau (CFPB) found that in 2010, 26 million adults in the US were “credit invisible” (meaning they had no credit files or records of credit activity at all), accounting for approximately 11% of the adult population. 2
4. 8.3% of Americans have no credit score
In a similar vein, in 2010, 19 million adults were “unscorable” due to an insufficient credit history (too few credit accounts or not enough recent account activity) according to the CFPB. 2
5. Roughly 20% of adults have inactive or nonexistent credit files
FICO statistics from 2020 show that altogether, 52.8 million people in the US have one of the following:
- No credit score
- No credit history
- Inactive credit files
People like this account for roughly 20% of the US population. 3
Profiles of Adults with Little/No Credit Activity
| Classification | Profile | Median Age | Credit Bureau Data Available | Population |
|---|---|---|---|---|
| New to Credit | Students, young adults, recent immigrants | 23 years old | Only credit checks or accounts less than 6 months old | 3.9 million |
| Credit Retired | Consumers with no credit activity in the past 6 months | 73 years old | Only stale data (most recent activity 4.5 years ago on average) | 7.4 million |
| Lost Access to Credit | Consumers facing economic difficulty | 43 years old | Only negative information | 16.2 million |
| No Credit Bureau Records | Gen Z/Millennials, recent immigrants | 27 years old | No usable credit data | 25.3 million |
| TOTAL | 52.8 million |
Data provided by FICO. 3
FICO reported that their results from 2020 are in line with the results obtained in a study conducted by the Consumer Financial Protection Bureau (CFPB) using data from 2010.
6. Low-income adults are more likely to have no credit score
Nearly 50% of low-income adults are credit invisible or unscorable. 2 Research has shown that people living in low-income areas are much more likely to have no credit file or no credit score than those living in higher-income areas.
7. Black and Hispanic Americans are more likely to have no credit score
The CFPB found that 15% of Black and Hispanic Americans are credit invisible (compared to 9% of White and Asian Americans), and an additional 13% of Black Americans and 12% of Hispanic Americans are unscorable (compared to 7% of White Americans). 2
8. 23% of Americans have never checked their credit scores
Even though credit monitoring is a key part of maintaining your financial health and improving your credit literacy, a 2019 survey conducted by Javelin Strategy & Research found that 23% of adults have never checked their credit scores. 4
9. 82% of Americans have checked their credit scores, and 21% check them frequently
According to Javelin Strategy & Research’s survey, 77% of adults have checked their credit scores at some point. 4 They found that 27% of respondents checked their credit score monthly, 15% checked every few months, and 10% had checked within the last 12 months.
10. The highest credit score in the US is 850
Every major credit scoring model sets 850 as the highest possible credit score you can get. All three of the national credit bureaus (Equifax, Experian, and TransUnion), the companies that compile the data on your credit report that’s used to produce your score, also consider 850 to be a perfect credit score because they follow the same scoring systems.
11. 1.6% of Americans have a perfect 850 credit score
As of April 2019, 1.6% of people in the US have a perfect FICO score of 850. 5 Notably, this means that the percentage of people with perfect credit scores has nearly doubled in the past decade—only 0.85% of Americans had a perfect score in April 2009.
12. People with a high income are more likely to have a perfect credit score
High earners (those making $101,000–$150,000 per year) are more likely to have a perfect 850 FICO score than people in any other income group. 6
Percentage of Americans With a Perfect FICO Score by Income
| Income | Percentage with a perfect score |
|---|---|
| Under $25,000 | 8.10% |
| $25,000 to $50,000 | 11.49% |
| $51,000 to $75,000 | 18.74% |
| $76,000 to $100,000 | 20.49% |
| $101,000 to $150,000 | 21.09% |
| $151,000 to $250,000 | 20.09% |
Data from a 2018 Experian analysis. 6
13. Hawaii residents are the most likely to have a perfect credit score
In 2019, Hawaii was the state with the highest percentage of the population with a perfect credit score (2.62%). 5 Here’s a look at their competitors:
Percent of State Population with an 850 FICO Score
| Ranking | April 2009 | April 2014 | April 2019 |
|---|---|---|---|
| 1 | Hawaii (1.55%) | Hawaii (1.66%) | Hawaii (2.62%) |
| 2 | New Jersey (1.42%) | Connecticut (1.58%) | Connecticut (2.30%) |
| 3 | Connecticut (1.36%) | New Jersey (1.56%) | New Jersey (2.27%) |
| 4 | Maine (1.25%) | Maine (1.38%) | Minnesota (2.24%) |
| 5 | New Hampshire (1.17%) | New Hampshire (1.31%) | Maine (2.21%) |
Data provided by a 2019 FICO analysis. 5
These rankings show that the percentage of Minnesota residents with a perfect credit score has increased dramatically, with Minnesota taking over New Hampshire’s spot in the top five states.
14. Mississippi residents are the least likely to have a perfect credit score
Experian statistics show that only 0.51% of people in Mississippi had a perfect credit score in 2018, making them the lowest-ranking state in terms of the percentage of the population with an 850 credit score. 6
15. Older generations are more likely to have a perfect credit score
According to an Experian study, baby boomers had the largest share of perfect credit scores (54%) in the fourth quarter of 2018. 6 Next up was Generation X (25%) and then the silent generation (13%).
FICO credit score statistics
Because the FICO model is by far the most popular credit scoring model, you can take a look at some statistics on FICO scores in the US to find out where you stand with lenders and how you compare to your peers. 7
16. FICO scores are used in more than 90% of lending decisions
A study conducted by the Mercator Advisory Group in 2018 found that between FICO scores vs. other credit scores, lenders chose to use FICO scores in more than 90% of lending decisions, including applications for credit cards, mortgages, and auto financing. 7
17. 67% of Americans have a “good” FICO score
Experian data indicate that 67% of adults in the US have a FICO score of 670 or higher, falling into the good, very good, or exceptional ranges. 8
Percentage of the US Population in Each FICO Scoring Range
| Credit score range | Percentage of population |
|---|---|
| Poor (300–579) | 16% |
| Fair (580–669) | 17% |
| Good (670–739) | 21% |
| Very good (740–799) | 25% |
| Exceptional (800–850) | 21% |
Data provided by Experian. 8
From these statistics, we can also conclude the following:
- 21% of Americans have a FICO score over 800.
- 33% of Americans have a “fair” or “poor” FICO credit score.
- 67% of Americans have a FICO credit score in the “good” range or higher.
Currently, the average FICO score in the US is 716, and the average VantageScore credit score is 695, both of which are considered good credit scores.
18. FICO scores increase with age
Average credit score statistics by age show that older adults tend to have higher credit scores than younger adults.
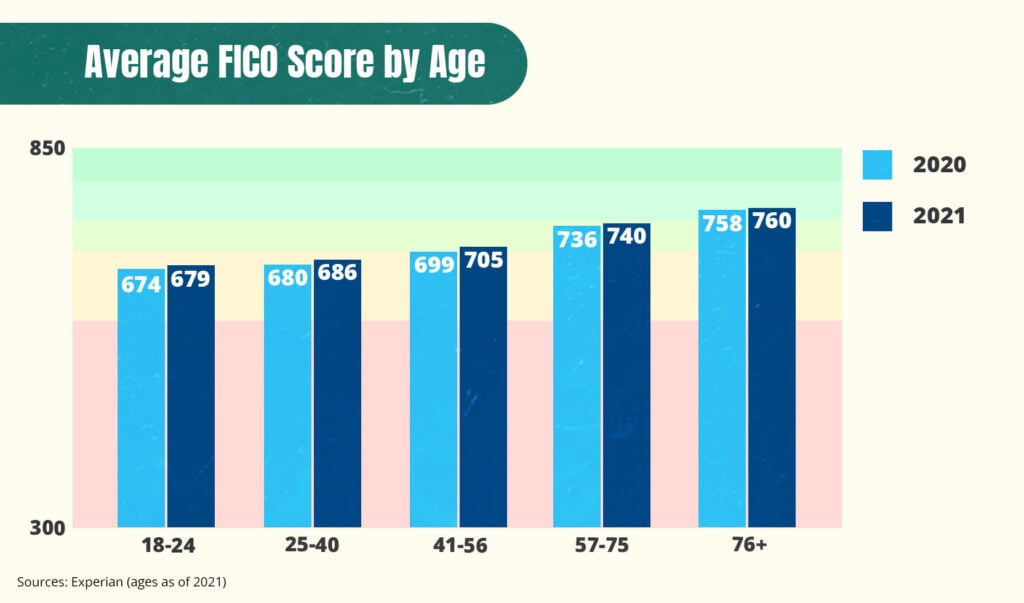
Data taken from an Experian survey on credit scores.
19. Millennials in Minnesota have the highest credit scores
Millennials in Minnesota have higher FICO credit scores on average than millennials in any other state, according to an Experian report. 9
Millennial FICO Scores: Top 5 States
| State | Average FICO Score | Average Income | Average Credit Card Debt | Average Number of Credit Cards |
|---|---|---|---|---|
| Minnesota | 716 | $64,674 | $4,243 | 3.14 |
| Washington, D.C. | 715 | $90,043 | $5,118 | 3.07 |
| Massachusetts | 710 | $81,995 | $4,396 | 3.31 |
| Washington | 710 | $70,441 | $4,582 | 3.25 |
| Utah | 707 | $53,539 | $4,236 | 3.15 |
Data provided by Experian. 9
These figures also show that millennials in Massachusetts have the highest income ($81,995) but not the highest credit score. This provides confirmation that your income doesn’t determine your credit score, although it certainly influences it.
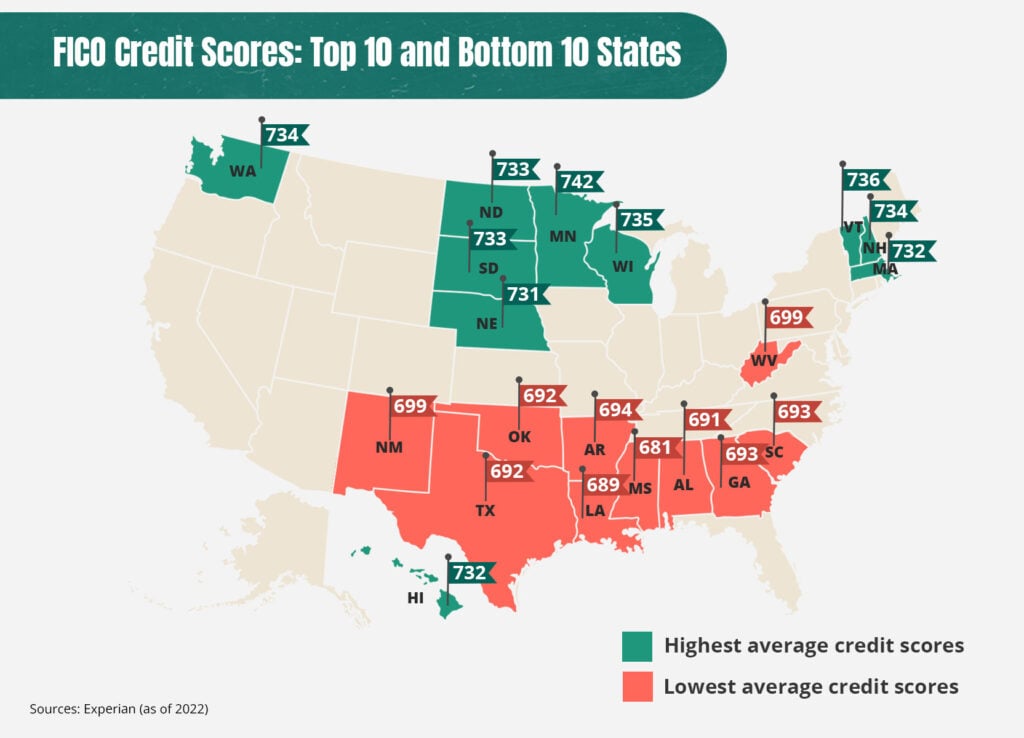
20. Minnesota residents have the highest average FICO score
As the image below shows, Minnesota is in the lead when it comes to FICO scores, with residents having an average score of 742.
Highest and Lowest FICO Scores by State
See the table below for the full data set.
State Credit Score Rankings
| State | Average credit score |
|---|---|
| Minnesota | 742 |
| Vermont | 736 |
| Wisconsin | 735 |
| New Hampshire | 734 |
| Washington | 734 |
| North Dakota | 733 |
| South Dakota | 733 |
21. San Francisco is the US city with the highest FICO score
The San Francisco Bay Area has the highest average FICO score of any metropolitan city (746), followed by Minneapolis/St. Paul (743) and Boston (742).
22. People who spend more on their credit cards have lower FICO scores
People with very poor FICO scores (300–579) have an average credit utilization rate of 73%. This percentage (also known as debt-to-credit ratio) reflects how much of your available credit you’re using on revolving credit accounts (like credit cards).
73% is remarkably higher than the 5.7% average credit utilization rate of people with scores of 800 or higher.
Average Credit Utilization Rate by FICO Score
| FICO Score Range | Average Credit Utilization Ratio |
|---|---|
| Very Poor (300–579) | 73% |
| Fair (580–669) | 51% |
| Good (670–739) | 32.6% |
| Very Good (740–799) | 12.4% |
| Exceptional (800–850) | 5.7% |
Data taken from Experian. 10
23. Married adults have more debt than single adults
Statistics show that married adults have around twice as much debt as single adults. They’re also much less likely to have late payments on their credit report, showing that they tend to be more financially stable even if they usually hold more debt.
Average FICO Score by Marital Status
| Marital Status | FICO Score | Credit Card Debt | Personal Loan debt | Average Total Debt | Delinquency Ratio |
|---|---|---|---|---|---|
| Single | 659 | $4,870 | $9,314 | $51,264 | 32% |
| Married | 715 | $6,881 | $18,799 | $112,627 | 15% |
Data provided by Experian for the second quarter of 2019. 11
VantageScore statistics
Although VantageScore models aren’t as widely used as FICO models, they’re still worth learning about. You can never predict which credit scoring model your lender will prefer.
24. 62.5% of Americans have a “good” VantageScore
The latest statistics from February 2022 show that the majority of scorable adults in the US have a credit score in the “prime” range of 661 or higher. 12
VantageScore Distribution in the US
| Year | Sub-Prime (300–600) | Near Prime (601–660) | Prime (661–780) | Super Prime (781–850) |
|---|---|---|---|---|
| February 2022 | 20.6% | 17.0% | 33.9% | 28.6% |
| February 2021 | 22.3% | 17.4% | 32.6% | 27.7% |
Data provided by VantageScore. 12
25. Older generations tend to have higher VantageScores
Like the case with FICO scores, VantageScores tend to be higher among older generations than among younger ones.
Average VantageScore by Age Group
| Generation | 2019 | 2020 | 2021 |
|---|---|---|---|
| Gen Z | 644.8 | 653.9 | 660.5 |
| Gen Y (Millennials) | 648.5 | 658.1 | 667.4 |
| Gen X | 667.8 | 675.5 | 685.2 |
| Baby Boomers | 710 | 715.9 | 724.2 |
| Silent Generation | 729 | 729 | 729.9 |
| US Average | 681.9 | 688 | 695.3 |
Data provided by Experian. 13
These statistics also show that Gen X demonstrated the greatest improvement in their credit scores from 2020 to 2021 (1.44%), whereas millennials showed the greatest improvement from 2019 to 2021 (2.91%).
26. Minnesota residents have the highest average VantageScore
The most up-to-date VantageScore data from February 2022 show that once again, Minnesota is in the lead with the highest average VantageScore of any state.
Highest and Lowest VantageScores by State
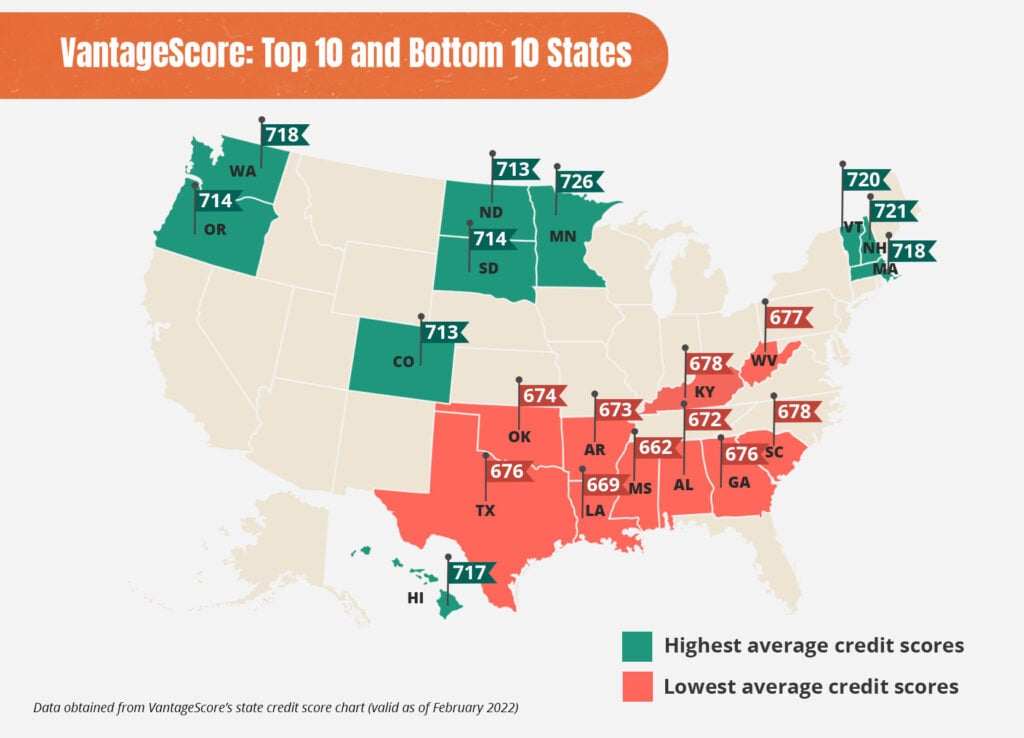
27. Mississippi residents have the lowest average VantageScore
Like the case with Mississippi’s average FICO score, their average VantageScore is the lowest in the nation at 662 as of February 2022. 12
28. People with higher incomes have higher VantageScores
Data from February 2022 show that VantageScores tend to be higher among people with higher income levels and lower among those with low income levels. This is similar to the case with FICO scores.
Average VantageScore by Income
| Credit Score Range | Low Income (<$50,000) | Middle Income ($50,000–$149,999) | High Income ($150,000+) |
|---|---|---|---|
| Subprime (300–600) | 29.7% | 16.4% | 7.0% |
| Near-prime (601–660) | 17.9% | 13.4% | 8.4% |
| Prime (661–780) | 32.0% | 34.1% | 31.3% |
| Super-prime (781–850) | 20.4% | 36.0% | 53.3% |
Data provided by VantageScore (valid as of February 2022). 12
Credit score requirements
The amount of debt you have plays a big role in determining your credit score. Here’s a look at how debt levels vary according to credit score and how they differ among people in different cohorts.
29. Most conventional mortgages require a credit score of 620 or higher
You typically need a credit score of 620 to get a conventional mortgage, although you can still get other types of mortgages with lower credit scores. 14 For example, you can get an FHA loan with a credit score of 500 or higher.
Mortgage Rates by Credit Score
| FICO Score | APR | Monthly payments (30-year fixed) | Monthly payments (15-year fixed) |
|---|---|---|---|
| 760–850 | 3.191% | $1,296 | $2,099 |
| 700–759 | 3.413% | $1,333 | $2,132 |
| 680–699 | 3.590% | $1,362 | $2,158 |
| 660–679 | 3.804% | $1,399 | $2,190 |
| 640–659 | 4.234% | $1,473 | $2,254 |
| 620–639 | 4.780% | $1,570 | $2,338 |
Like the case with pretty much all types of credit, having a higher credit score generally qualifies you for lower interest rates on mortgages.
30. People approved for a car loan have an average credit score of 726
Although there’s no universal minimum credit credit score required to get an auto loan, data show that people approved for an auto loan in 2021 had an average credit score of 726. 15
Among these borrowers, people who financed a used car in 2021 had an average credit score of 675, and those who financed a new car had an average credit score of 733.
31. Over 64% of people given car loans have credit scores of 661 or higher
The majority of car loans are given to people with prime or super prime credit scores. Borrowers with scores between 501 and 660 accounted for about 34%, while less than 2% of the financing went to people with scores below 500.

Data from Experian’s Q3 2021 report on the auto financing market. 15
32. Auto loan interest rates are over 3 times higher for non-prime borrowers
According to Experian’s 2021 report on auto financing, the average interest rate given to non-prime borrowers (credit score of 300–660) for new or used car loans is 12.46%, whereas the average interest rate given to prime borrowers (credit score of 661–850) is only 3.82%.
Average Auto Loan Amounts and Rates by Credit Score Range
| Credit Score | Loan Amount | Monthly Payment | New Car APR | Used Car APR |
|---|---|---|---|---|
| Deep subprime (300–500) | $29,952 | $587 | 12.99% | 19.85% |
| Subprime (501–600) | $35,092 | $631 | 9.92% | 15.91% |
| Near prime (601–660) | $39,310 | $642 | 6.32% | 9.77% |
| Prime (661–780) | $38,896 | $616 | 3.64% | 5.35% |
| Super prime (781–850) | $33,915 | $579 | 2.58% | 3.68% |
Data provided by Experian. 15
Lenders look at your credit score and credit history when deciding what loan terms to give you, and they’ll usually charge you a higher interest rate if you have poor credit. This is because they see you as being at greater risk of not repaying your loan.
33. Used car loans have higher APRs
Statistics from 2021 show that the average APR for an auto loan to buy a new car is 7.09%, whereas the average APR for a used car is 10.91%. 15
34. People with lower credit scores have higher credit card APRs
As is the case with pretty much all types of credit, your interest rate will be higher if you have a lower credit score. This applies to credit cards as well. 16
Average Credit Card APR by Credit Score
| Year | Superprime | Prime | Near-prime | Subprime | Deep subprime | Overall |
|---|---|---|---|---|---|---|
| 2017 | 17.7% | 20.8% | 22.2% | 23.0% | 23.7% | 19.3% |
| 2018 | 18.8% | 21.8% | 23.2% | 23.9% | 24.5% | 20.3% |
| 2019 | 18.9% | 22.2% | 23.8% | 24.6% | 25.1% | 20.6% |
| 2020 | 17.5% | 21.0% | 22.6% | 23.3% | 23.9% | 19.2% |
35. Credit card APRs are declining
Statistics show that there was a noticeable dip in the average credit card APR from 2019 (20.6%) to 2020 (19.2%). 16 This could be due to changes in the economy and consumer spending resulting from the COVID-19 pandemic.